US SMALL CAPS · 04:00 ET ONWARD
Depth on the moving market, at a glance.
TMI is an intelligence desk for small-cap momentum traders. It takes the names already moving and compiles what matters about each one into a board you can read in seconds, with the full research one click deeper. Where it has nothing, it says so.
Free for 48 hours, not counting weekends and market holidays. Or $5.50 for each day you use the desk. Plans cost less per trading day. In US dollars · Sign in with Google or email · No brokerage connection
NOW
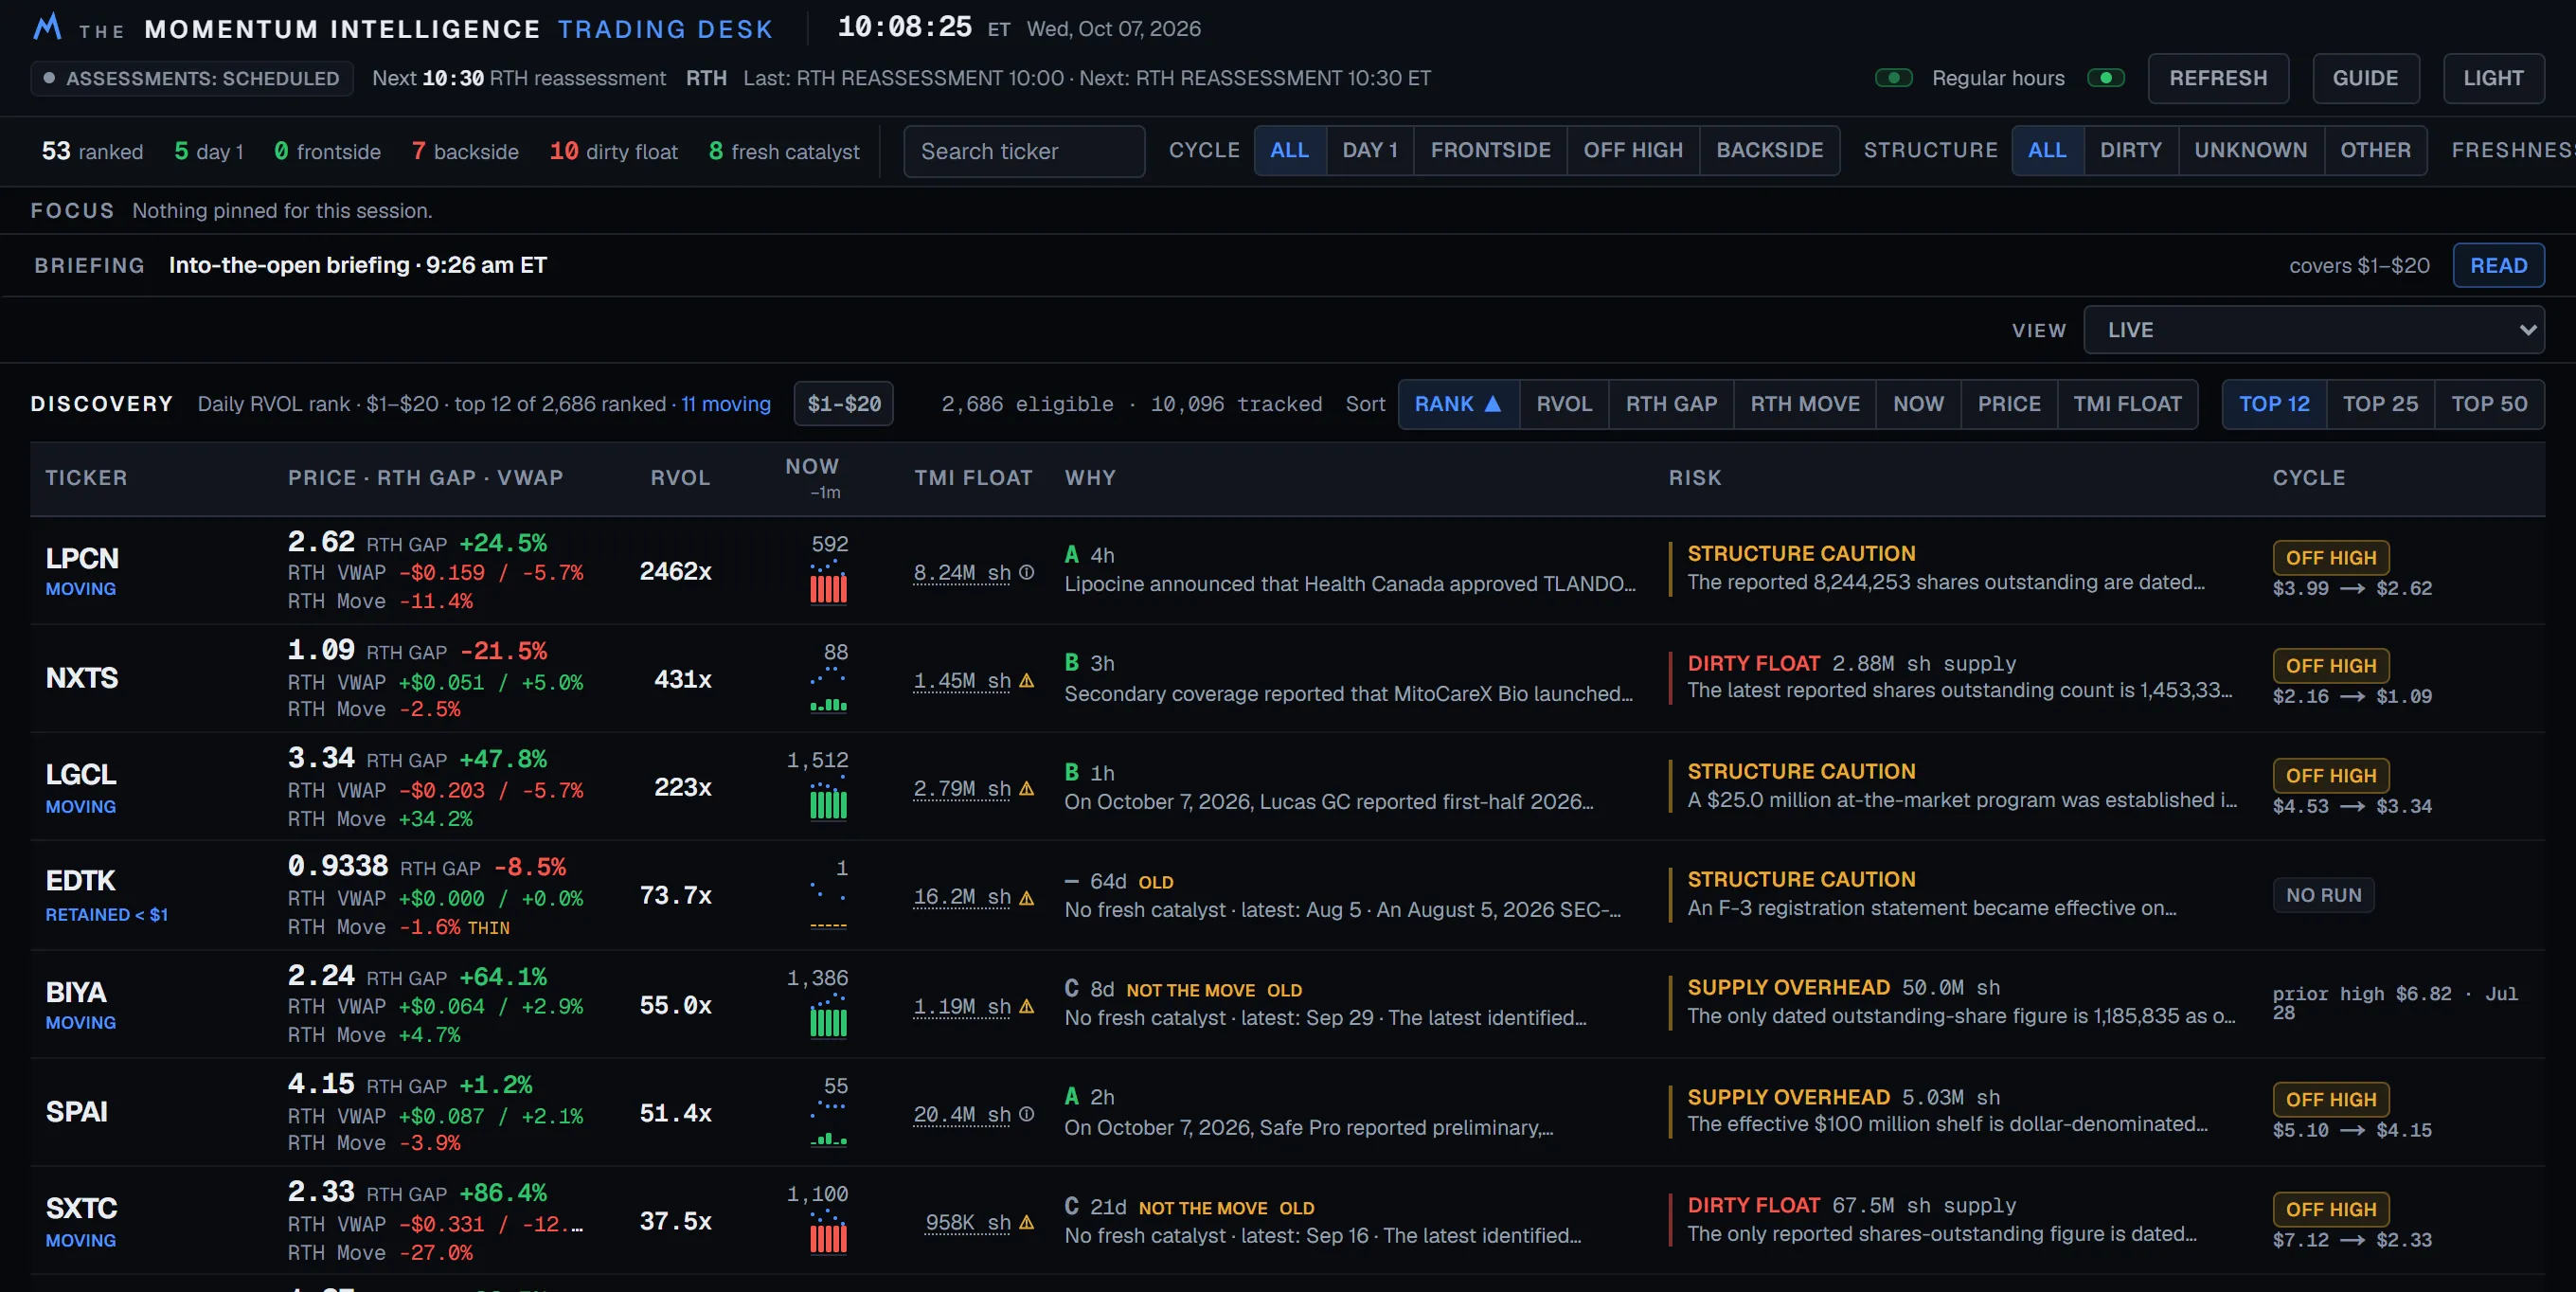
Which names on the board are trading heaviest right now.
Volume for the day only goes up, so a name that ran at 7:15 and stopped can still look huge at 10:00.
When the count is live, Now counts trades in the most recent completed ten seconds, and draws the last minute as six small bars with a dot for the price in each. Sort by Now to put the heaviest names first.
If the count stops, the column says "not live" and shows nothing rather than an old number.
Green means the price rose over the last minute by more than the spread; red, that it fell by more than the spread; amber, that it moved by no more than the spread. With too little data to judge, there is no colour.
Read it beside Cycle, which is measured from daily bars: Day 1, Frontside, Off high, Backside or Prior run, with the run's high and the last price, such as $1.84 → $1.52. When today's high is the high the move is measured against, Cycle reads NEW HIGH if the price is within a spread of it. When the count is live, together they show which names are trading heaviest and which way each has moved over the last minute, and Cycle shows where each sits in its run.
PRICE LEVELS
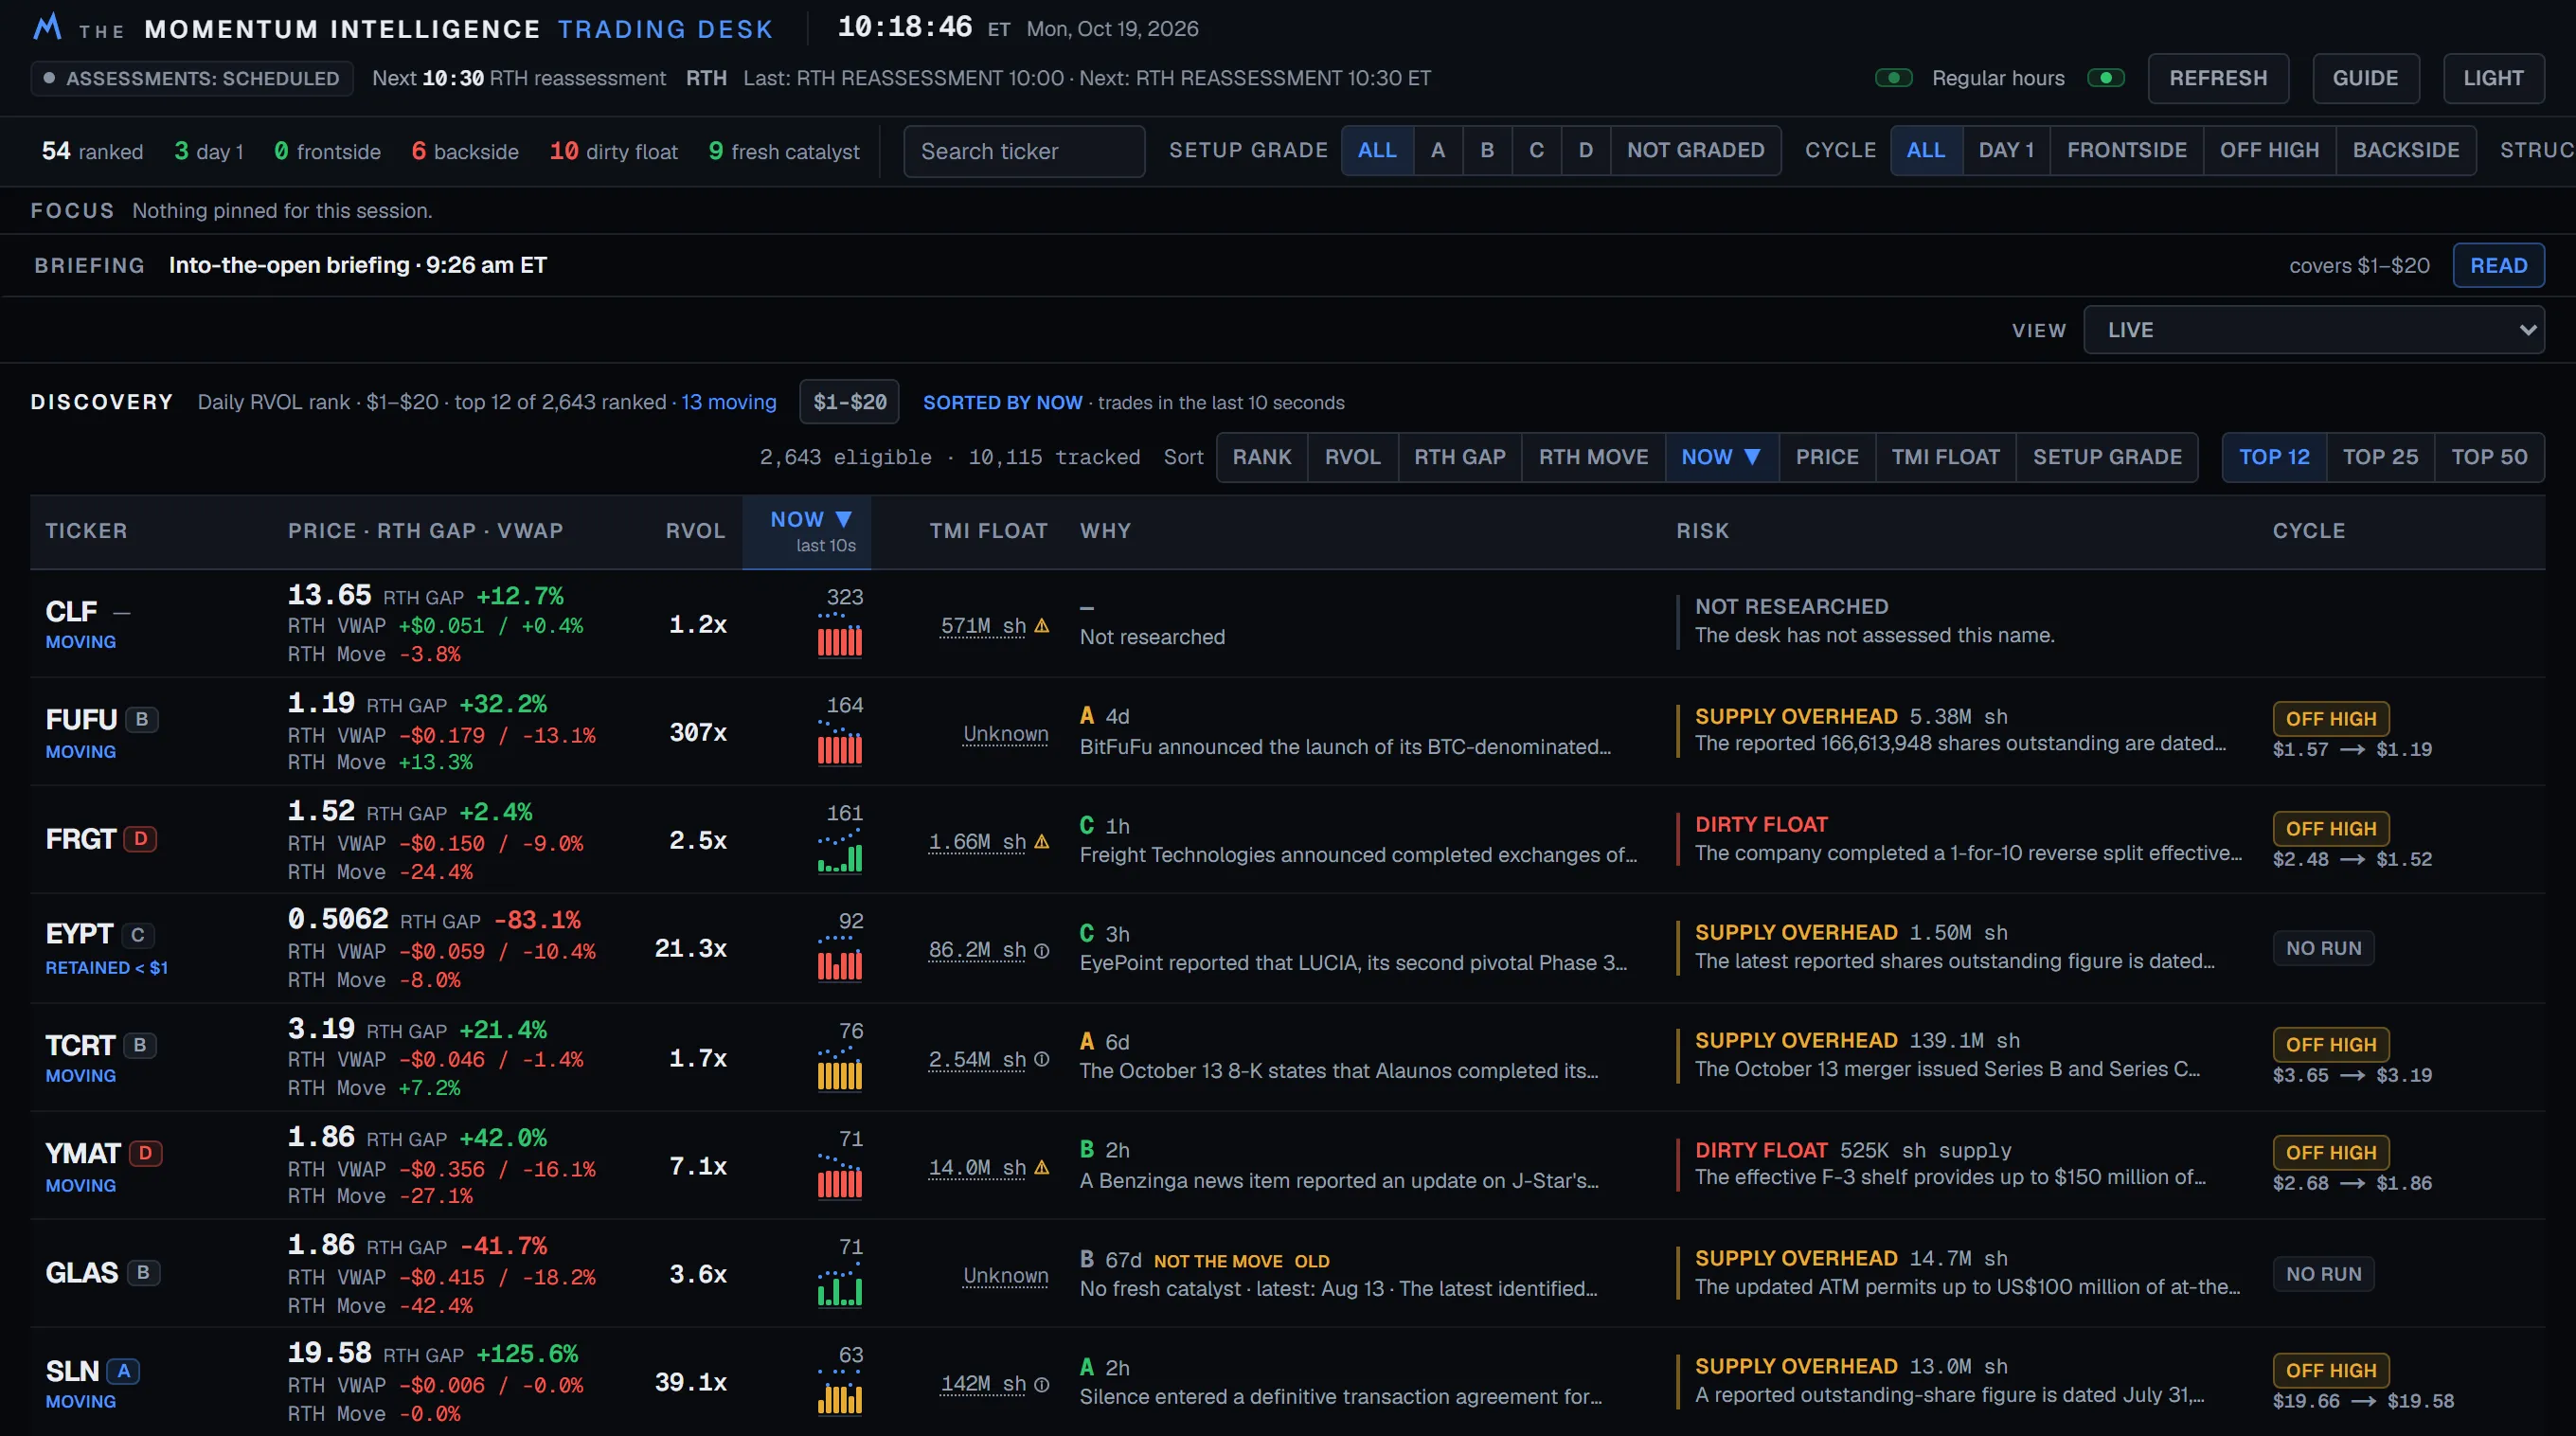
The resistance levels, already marked.
Marking them by hand means working left and up from the current price on a chart, picking out the recent candle tops one at a time.
Open a name ranked 90th or better and the desk has done it: its resistance levels are listed, each with the timeframes it came from and, while the price is still below it, its distance from the price.
They are candle tops, wicks not bodies, found by walking back from the newest candle and taking each earlier top that is higher than the last. Today's tops come from 5-minute candles, earlier sessions from 15-minute candles, and anything older from daily candles out to 12 months, and the nearest top further back when the price is above all of them. Neighbouring tops no more than 0.5% of the price apart merge into one level, placed halfway between its lowest and highest top.
They are recomputed at each 5-minute close for the names ranked 90th or better. They are past highs; the desk does not say the price will stop at one.
THE BOARD
Four questions. One click each.
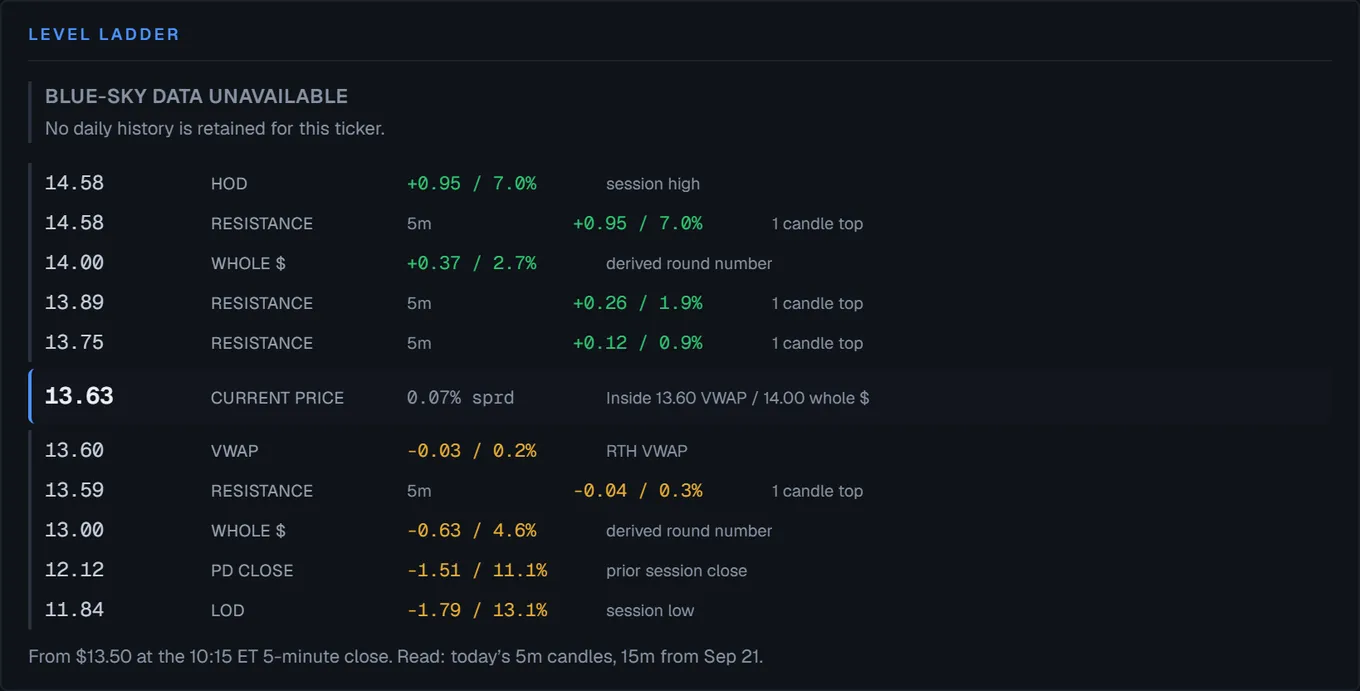
The board ranks the names already moving in your price range, against each stock's own twenty-session norm. Then sort it by the question you are asking right now.
- Gap
- How far has it come since the last close?
- Move
- What has it done since this session's first trade?
- RVOL
- How busy has it been today, against its own normal?
- Now
- How busy is it right now?
Gap and Move are labelled by session: PM, RTH, AH. A name that gapped and then moved the other way from the open shows both.
Next to the number, the reason.
It is 07:15, a name is running, and nothing you can find explains it.
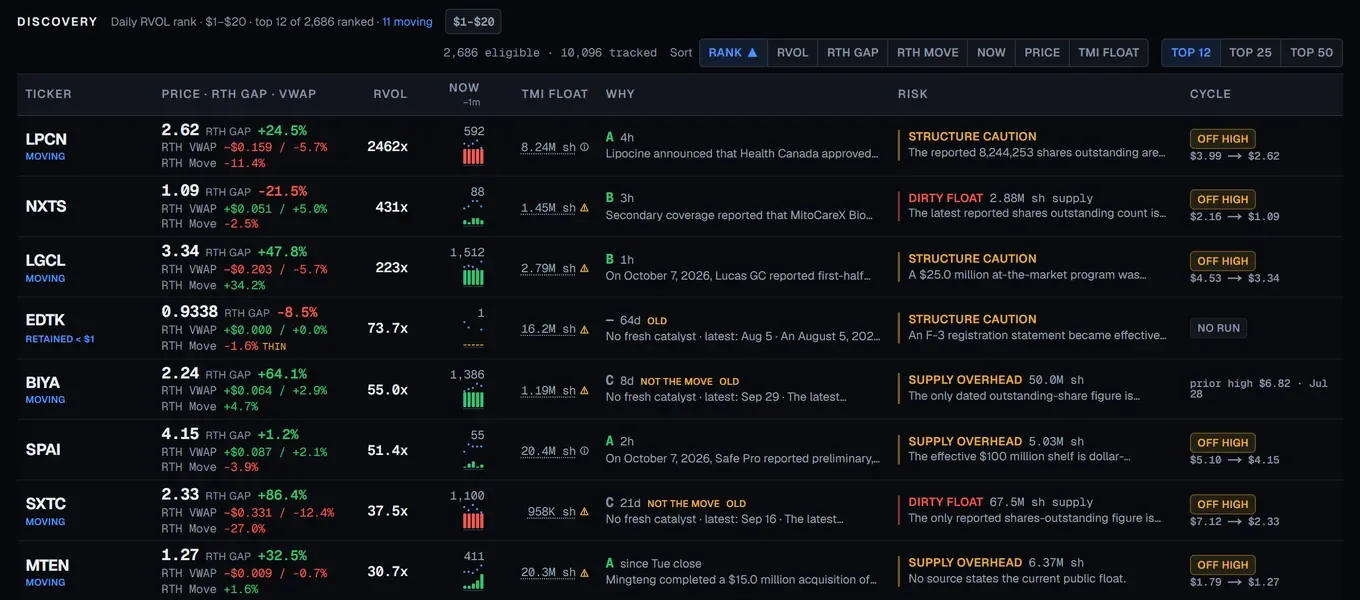
Each row shows what the desk has, in words you already use.
Why
A catalyst grade from A to C. The letter is strength, the colour is freshness, so a green A and an amber A are the same strength and different news.
Cycle
Day 1, Frontside, Off high, Backside or Prior run, with the run's high and the last price beside it.
Risk
One plain label, such as Dirty Float, Supply Overhead or No Flag Found.
Price
The distance from the session's VWAP.
OPEN A NAME
The summary on top. The work underneath.
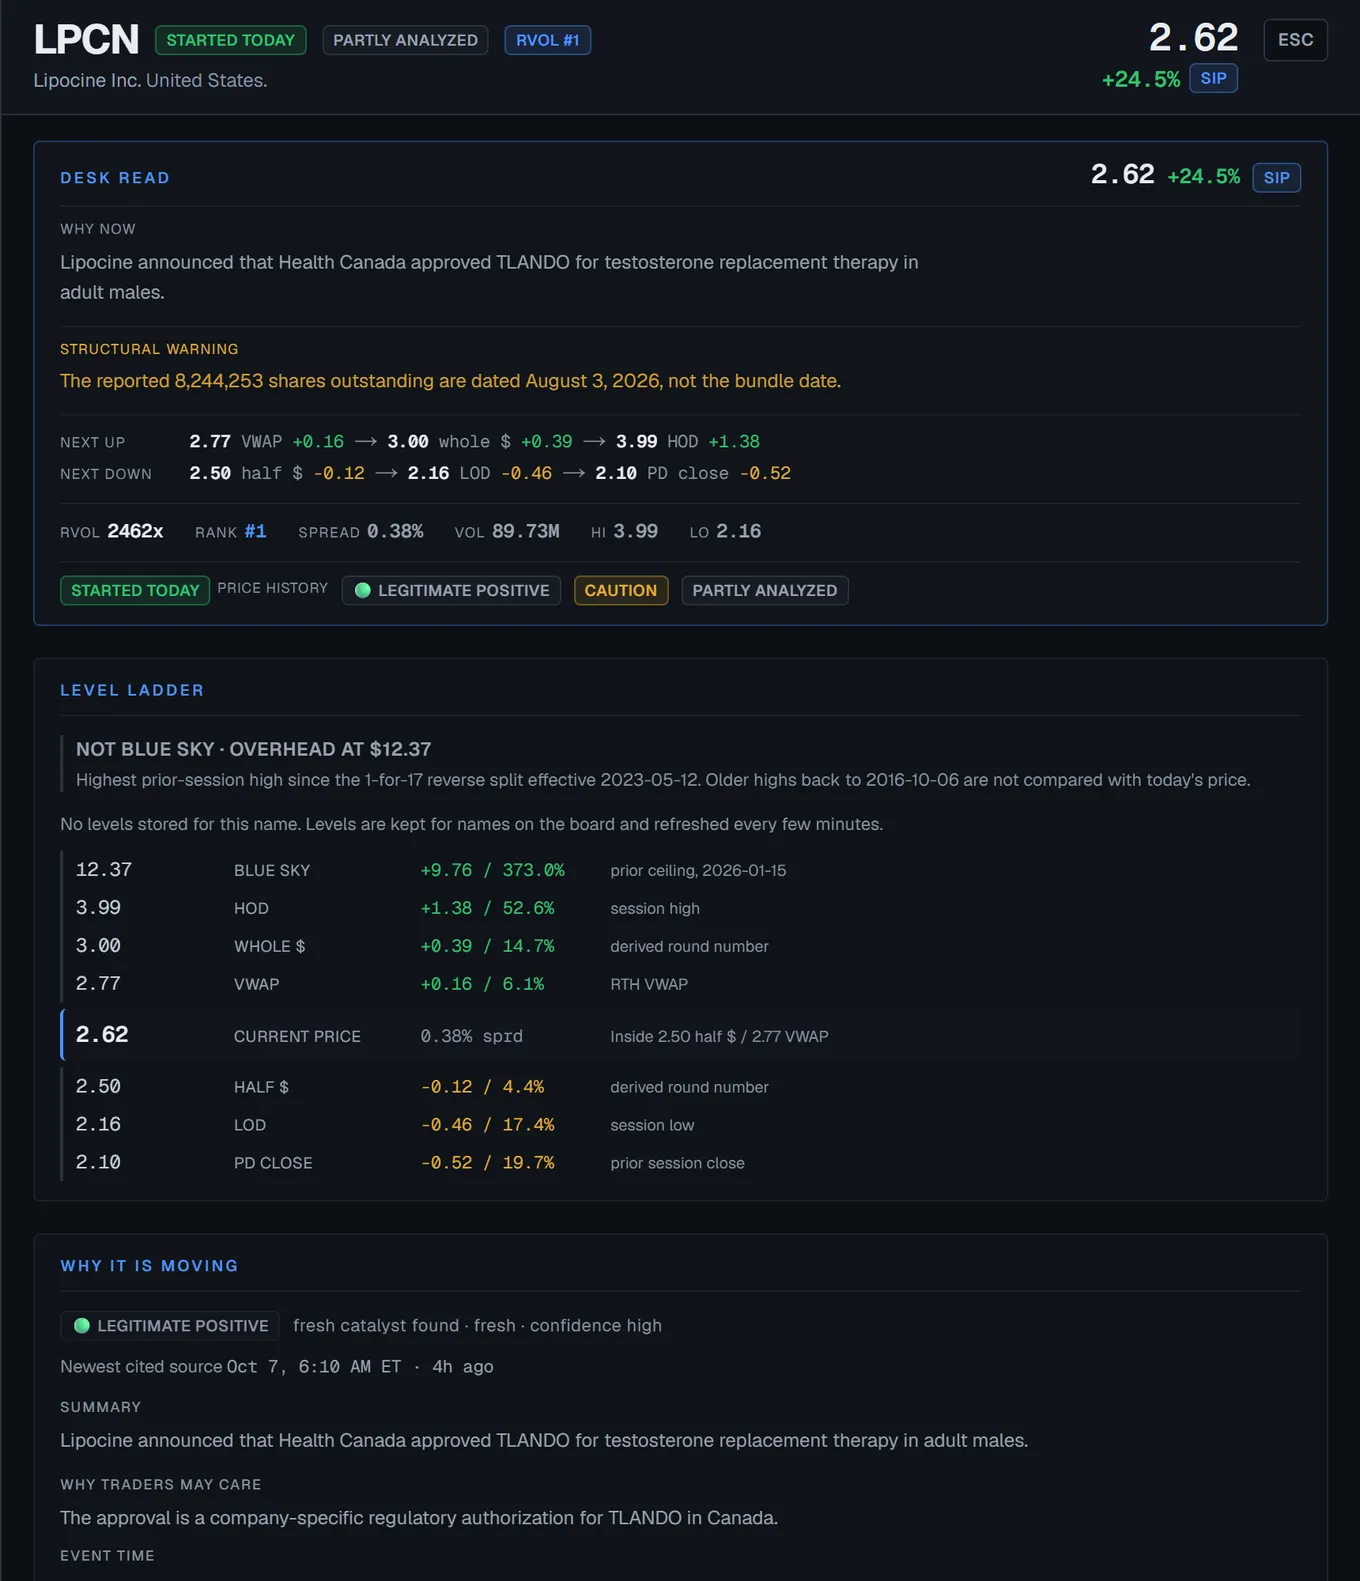
Click a name and the drawer opens with the Desk Read: cycle, catalyst and structure as three badges, the nearest level above and below, and one line on why now. Below it, the research. Below that, the sources, for when you want to check the work.
- Level ladder: the price levels around the current price, with the distance to each.
- Why it is moving: the catalyst, its sources and its time, and whether it plausibly explains the move.
- Structure: the TMI Float, shown as a ceiling with its date, shares outstanding, and the supply from the filings.
- Evidence: the sources the desk cites, with their dates where it has them.
WHAT IS UNDERNEATH THE MOVE
Supply, in the groups a trader recognises.
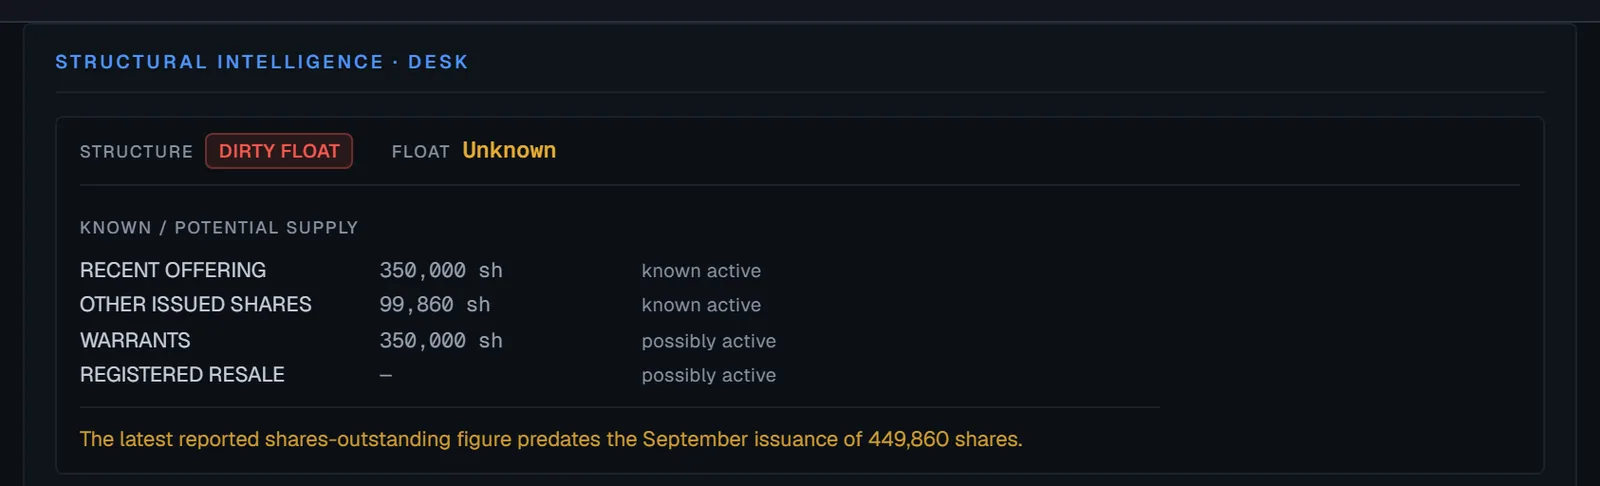
A filing establishes capacity, never intent: the board does not say anyone is selling. When a float label reads DIRTY FLOAT, it means one thing: the displayed float understates the shares that can reach the market.
BRIEFINGS
A briefing at each session boundary.
| Briefing | Due |
|---|---|
| Into the open | 9:25 am ET |
| Power hour | 2:30 pm ET |
| After hours | 4:00 pm ET |
| Evening | 8:05 pm ET (published by 8:30 pm), with a second edition at 10 pm |
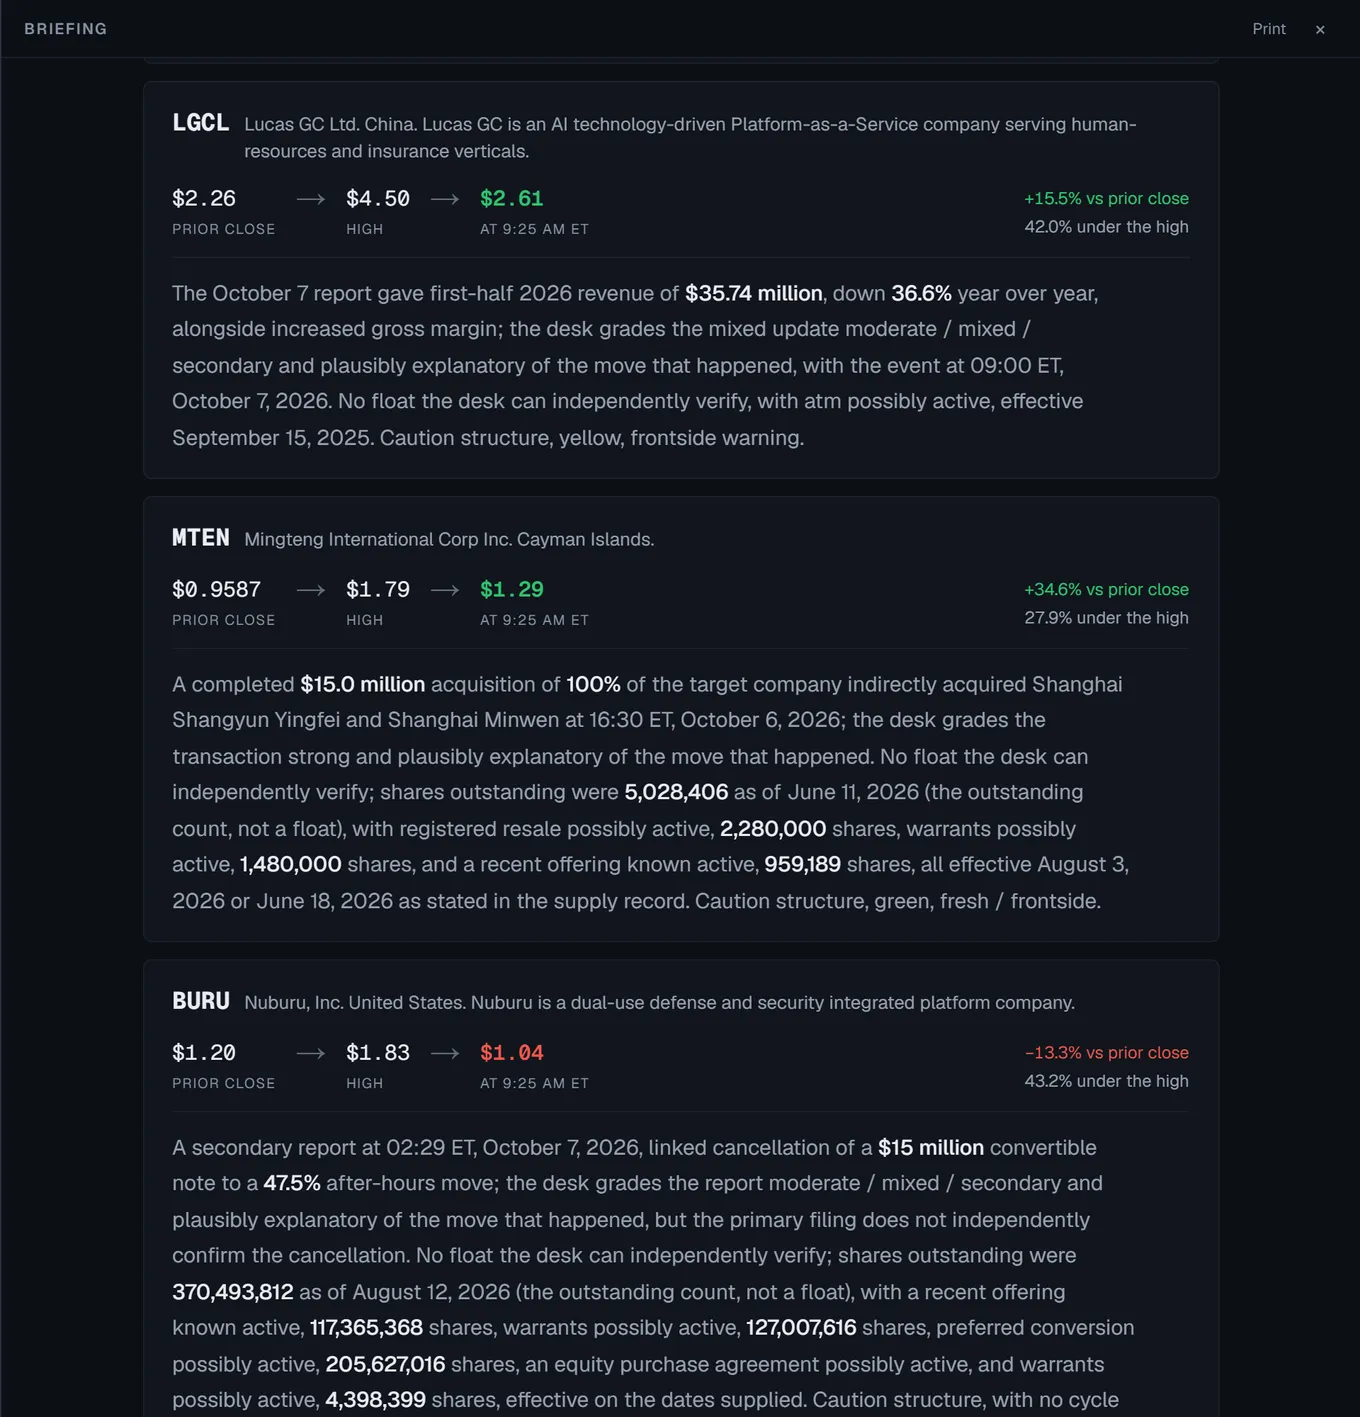
Each one is a short written summary, then the names grouped by what the research found. Each line is checked before it is shown, against the facts the desk gave the writer and for advice language, and a line that fails is left out. A check can miss something.
Your names, kept close.
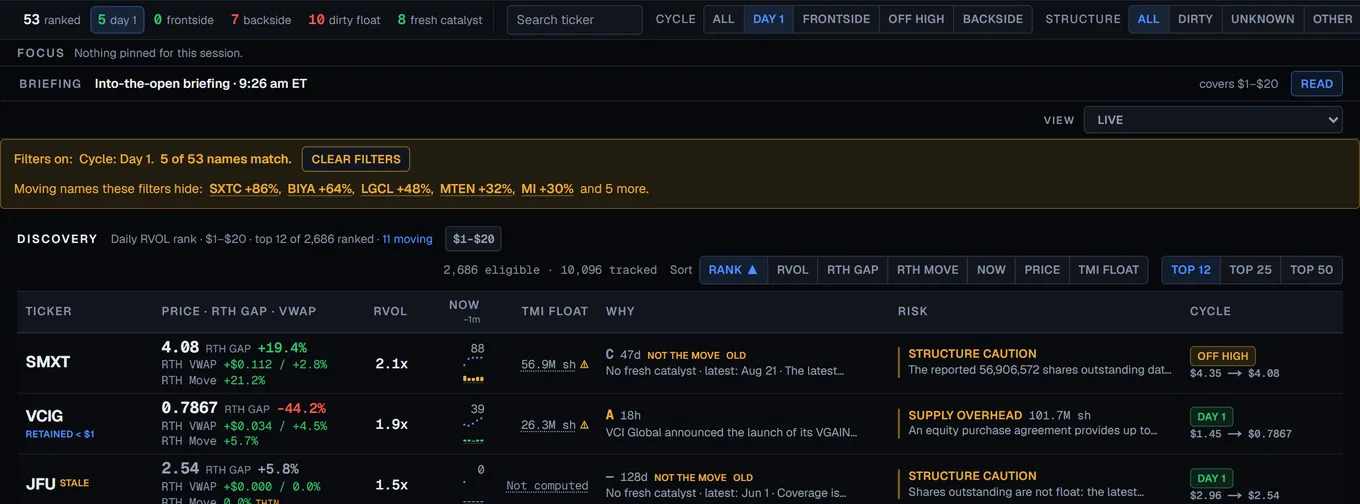
- Focus: pin up to six names. Price, structure and the nearest levels stay in view while you scan.
- One-click filters: click a count in the summary line, such as "day 1" or "dirty float", and the board narrows.
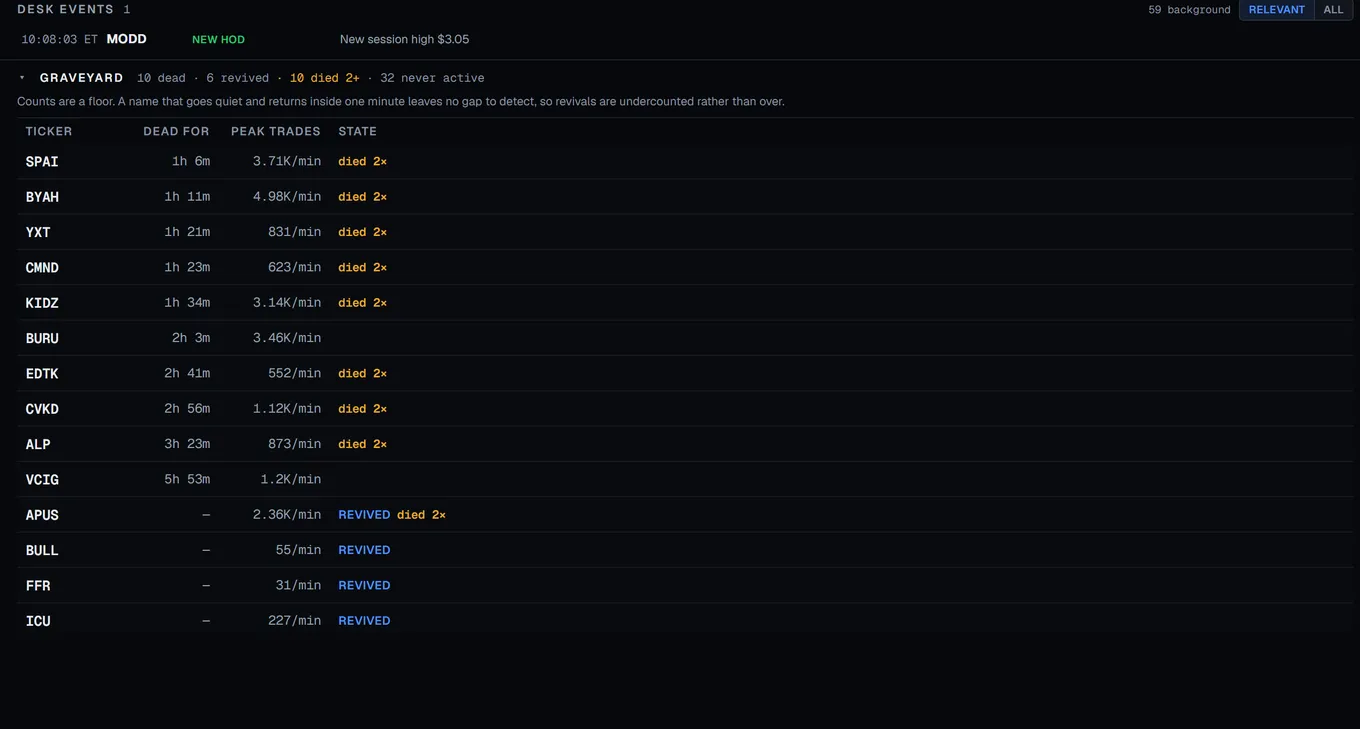
- The graveyard: a name that goes quiet leaves the board but not the desk. If it starts trading again, it is marked.
- Checkpoints: the desk keeps the board as it stood at set times through the day. Open any of them to see it.
- After the bell: the board re-ranks on after-hours participation, measured against the same twenty-session norm.
Unknown stays unknown.
- "Not researched" and "researched, nothing found" look different, so you know whether the desk looked.
- A dash in a cell means the desk has no value to show.
- When the market data is old, a line above the board says so and gives the time of the last number.
- The market, research and assessment lights are separate, and each shows its own state.
Pay by the day, or by the plan.
Try it free for 48 hours, not counting weekends and market holidays.
In US dollars.
Daily
$5.50 a day
You pay only for the days you use the desk.
Monthly
$89 a month
About 23% less than paying daily. About $4.26 a day.*
Six months
$499 for six months
About 28% less than paying daily. About $3.98 a day.*
Annual
$899 a year
About 35% less than paying daily. About $3.58 a day.*
*Against $5.50 for every trading day in the period: 20.9 trading days in an average month, 125.5 in six months, 251 in a year. A month with fewer or more trading days changes the figure.
BOUNDARIES
What it is not.
The Momentum Intelligence Trading Desk is built for people who trade $1–$20 small-cap momentum in the premarket. It is not a signal service: it takes the names that are already moving and puts everything the desk knows about each one on a single shared board. Why it is moving, where it sits in the cycle, what the share structure is, and what supply stands behind it. Where it has nothing, it says so.
Not a broker
No account, no orders, no positions, no connection of any kind to your brokerage. It cannot place a trade and never asks for permission to.
Not signals
No entry arrows, no exit alerts, no chat room. Its grades and readings are the same for every reader.
Not advice
An information service about publicly traded securities. Not a broker-dealer and not an investment adviser. Its grades and readings are the same for every reader. They are not advice tailored to you or your circumstances.
Is there a free trial?
Yes. The free trial is 48 hours, not counting weekends and market holidays, once per person and per card. The clock stops from 8:00pm ET Friday to 8:00pm ET Sunday, and over a market holiday.
In a week with no market holiday:
| If you start | Your trial ends |
|---|---|
| Tuesday at 10:00am ET | Thursday at 10:00am ET |
| Wednesday at 5:00am ET | Friday at 5:00am ET |
| Thursday at 10:00am ET | Monday at 10:00am ET |
| Friday at 10:00am ET | Tuesday at 10:00am ET |
| Friday at 9:00pm ET | Tuesday at 8:00pm ET |
| Saturday at 2:00pm ET | Tuesday at 8:00pm ET |
| Sunday at 9:00pm ET | Tuesday at 9:00pm ET |
A start between 8:00pm ET Friday and 8:00pm ET Sunday counts from 8:00pm ET Sunday.
We ask for a card only so the same card cannot start a second trial. The trial never charges it, and we keep only a code that identifies it, not the card.
What does it cost?
The free trial is 48 hours, not counting weekends and market holidays, once per person and per card. A paid day costs $5.50. Plans are $89 a month, $499 for six months and $899 a year. Prices are in US dollars and include any sales tax. Plans renew on their own until you cancel.
What hours does it cover?
The live board runs from 04:00 to 20:00 ET on days the market is open: premarket, regular hours and after hours.
What does it cover?
The board ranks tickers priced $1 to $20 by default. You can set your own price range.
Does it connect to my broker?
No. It cannot see an account or place an order.
Where does the research come from?
SEC filings, exchange notices, company releases and newswires. The desk shows the sources it read, with their dates where it has them. The analysis is written automatically from them.
What do you collect?
From Google, your name, email, picture and account ID; if you sign in by email link, your email address and a short record of each link request. When you pay, your card number goes to Stripe, not to us, and we keep a record of each charge. If you start a free trial, we keep a code that identifies your card, not the card, and Stripe keeps a record of the card under its own privacy policy. From the desk, a record of what you do on it, the server logs every website keeps, and the cookies it needs to sign you in. Nothing from your brokerage, and no advertising or analytics trackers.
Does it work on my phone?
The desk is built for a computer screen at least 1,024 pixels wide, not for a phone.
Try it free for 48 hours, not counting weekends and market holidays.
Sign in and add a card to start the trial. We ask for a card only so the same card cannot start a second trial. The trial never charges it. Then the desk opens.
What we collect, and what we do not
TMI is developed by Andromeda Genius LLC, San Antonio, Texas.
The founders and developers that built and work on TMI Trader are momentum small-cap day traders themselves.